
Suddenly then gradually
The transition from fossil fuels to clean energy technology enters its gradual phase, where everything changes quickly

What energy we had when the universe was created is the energy we will end with: energy can neither be created nor destroyed but only changed from one form to another. The First Law of Thermodynamics
“World is suddener than we fancy it”: Louis MacNeice, Snow

Energy began to change form forever at the start of this century, but to begin with that went mostly over-looked.
It is often said that exponential growth happens “gradually then suddenly”, meaning it can take a lot of time to reach a limited scale, but when it does it becomes quickly noticeable.
With global energy this maxim is maybe upturned.
The shift in world energy is perhaps more “suddenly then gradually”, a rapid development of energy technology abruptly comes to life, grows quickly to maturity, but it faces an incumbent so large, that even as it grows apace it still seems small, and easy to ignore.
It then has to go through a gradual grinding phase of deployment to make an impact.
And here we are.
This is a short story of the clean energy technology revolution in the 21st century.
Good-enough technologies created quick standards
In 2000 or thereabouts new energy technologies emerged that were unlike any other energy system developed before.
About 50% of world energy is used for electric power and transport fuels – the other 50% mainly for industrial and residential heat, and non-energy use eg petrochemicals.
At the start of the century, both these energy sectors were fully dominated by fossil fuels: gas and coal in power, oil products (gasoline / diesel/aviation fuels) in transport.
Then came the new technologies to rival them: solar (and wind) power for electricity, electric batteries for transport.
Solar panels and lithium batteries had been patented then small-scale manufactured in the 1970s-90s, but by the early 2000s both had reached a stage where the chemistry and physics of their design settled into mass industrial positions.
In solar panels, crystalline silicon became dominant, today commanding over 95% of the PV solar panel technology market: in lithium batteries the lithium – iron – phosphate (LFP) combination prevailed, with 80% of the Chinese market and over 50% of the global market by 2025.
This was important: neither of these inventions was the technological leader, or even the cheapest option
But they had the key characteristic of being good-enough on most dimensions required: decent technology, reasonable cost, available raw materials, and amenable to increasing scales and size of manufacturing, using techniques that were already established.
This is what made them different in kind to previous energy technologies.
The chemistry and physics were lab-effective yes, but they already had the ability to quickly scale and improve at industrial levels.
Sudden emergence, sudden scaling.
Contrast this with the energy of the past centuries: fossil fuels rely on extraction of carbon molecules (fossil gas, crude oil, coal) in bulk and at vast scale.
In this way they are the antithesis of the new clean technologies: they do not work well at anything other than very large sizes, and can only be mined and processed where they are found (onshore, offshore, remote and differing geographies) meaning each project looks unlike all the others – and then the fuels extracted have to be processed and shipped to where they are needed, typically at high expense.
But clean energy technologies can now be built where it is most cost-effective in dedicated factories, then sent out into the world, or replicated in similar sites nearer to home.
Learning curves
This sudden surge of new technology and industrial manufacturing led to the rapid cost reduction in each solar panel, and each car or storage battery.
And as manufacturing and repetition is a learning process, these cost reductions continued year by year.
The general term for this is learning by doing, or learning curves, also called experience curves emphasising the processing gains as more and more standard units are built.
More precise terms are Wright’s Law, or Swanson’s Law (in solar panels). They both state that depending on the technology the costs reduce by a given percentage for each doubling of units manufactured (typically 15-20% each doubling).
And the faster the units are doubled, the quicker that percentage drop.
Take lithium batteries as example 1 - since 2000 the prices of these have dropped 96%, from over $2,000 per kWh, to under $100/kWh in 2025.
And solar panels as example 2 – since 2000 prices have fallen by – (yes, you guessed right) 96% - from over $6 per Watt to under $0.3 per Watt.
Money

source: Bloomberg NEF, IEA, Global Energy Monitor
Of course an awful lot of money must have been needed to induce all those manufacturing gains.
Cumulatively about $10trillion dollars have been spent this century on the key clean technologies of wind, solar, batteries and BEVs.
To put that in perspective the fossil fuel industry spent about $20 trillion in the same period.
The key change however has been the shape of that deployment of funds – see the chart.
The clean technology funding followed the shape and scale of the sudden emergence of economic and viable products.
With policy and subsidy support in the early years, the dropping cost of solar panels and batteries for grid storage and electric vehicles meant they could be deployed in more and more applications and projects, dropping the costs again, and so on - the learning curves working their indefatigable skills.
Eventually by around 2020 solar electricity became the cheapest form of electricity generation (cheaper than gas and coal), and batteries for cars cheap enough and good enough for BEVs to reach the mass market (especially in the world’s largest car market, China where they are cheaper than fossil fuels cars, and getting cheaper).
Solar and BEV investment are clearly the major drivers of this shift, as both are multi-trillion dollar markets (solar and BEV markets estimated at $3 trillion pa this decade).
Capex in clean tech has therefore followed the technology in a fast growth curve – the compound annual growth rate between 2000 and 2023 for fossil fuels was 2.5%; for clean technology 16.5%.
This means that from 2000 to 2023 fossil fuel investment doubled, clean technology investment grew 50 times.
2022 was also the year when clean technologies investments matched, then overtook fossil fuels investments on an absolute dollar basis for the very first time – a gap that has only widened in the past 2 years, and likely to continue.
This obviously has made a major impact on the physical energy landscape.
We may now be at the stage where the sudden surge is over, and we are in the gradual phase of energy transition: the phase where the new technology starts to slowly engulf and absorb the massive fossil fuel incumbents.
As noted, 50% of global energy is used in two mega-sectors, power and transport – so let’s look at those in turn.
Power (25% of global energy)
source: BP/EI Statistical Review, IEA, Ember Global Electricity Review
As the technology rises into the vast existing fossil fuel power system, we see the rise of investment and technology deployment work together, like DNA strands intertwined.
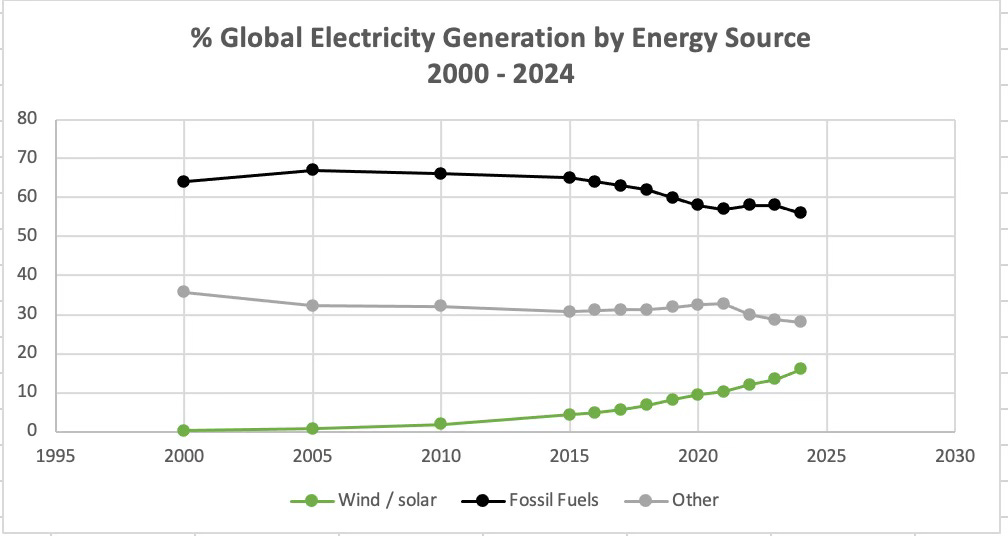
The chart above shows how world power via electricity generation is now gradually beginning to bend toward clean technology.
In 2015 only 4% of global electricity generation was powered by wind and solar.
In 2020, it was about 10%; by the end of this year it will be around 16-17% world-wide, perhaps over 20% in massive centres such as China.
By 2030 – likely over 30%.
Whilst global electricity use grows overall and population expands, the percentage of fossil fuels in the mix actually peaked back near 2005, even though in absolute terms they continue to grow slowly, (1.5% pa or less).
To over-turn such a huge system takes time: decades. And lived experience tells us: things still look the same, emissions still growing, gas and coal still being added to the mix.
So, how can the transition be happening at pace?
Well, both things can be true.
Fossil fuels had a century start on clean power technologies.
So at century turn in 2000, fossil fuels made up about 64% of global power generation (nuclear, hydro and biomass making up the rest), and still expanded to become over 67% in 2005.
But by 2024 fossil fuels made up only 55% of global power, and by 2030, at current displacement rates driven by wind and solar they will be below 50%, and headed downwards at an accelerating rate.
7,000 Power Plants
There are over 7,000 coal and gas power plants in the world, moving them aside with billions of solar panels and thousands of wind turbines will take sizeable quantities of, money, technology and time.
But as we have seen, that is exactly what is happening.
But don’t think of this as having to shutter fossil plants one by one, or there being a bell rung every time.
This can be a more stealthy, quiet process - many fossil plants in the OECD now run at only 35% capacity to avoid shut-down costs; new plants in China are likely to run at low capacities too, heading toward that 30-40% number from the start.
More realistically follow the generation numbers in the chart above: the collapse in fossil fuel generation can be a 30% reduction in plants, or a 0% reduction in plants, but generating power dialled back year by year until closure.
The comprehension of this change is a complex bundle of headlines, counter-narratives, political interventions and so on.
That is noise: the exponential growth and learning curves of wind and solar technologies the signal in the charts, hitting inflection points year by year
Wind and solar are now generating more electricity than hydropower, nuclear, or oil, having picked them all off one by one over the past 5-10 years.
By 2030 wind and solar will almost certainly generate more power than gas or coal too, making them, after a gradual three-decade climb, the primary source of global electric power.
Transport (25% of global energy)
source: BNEF, IEA, China Association Automobile Manufacturers, CAAM
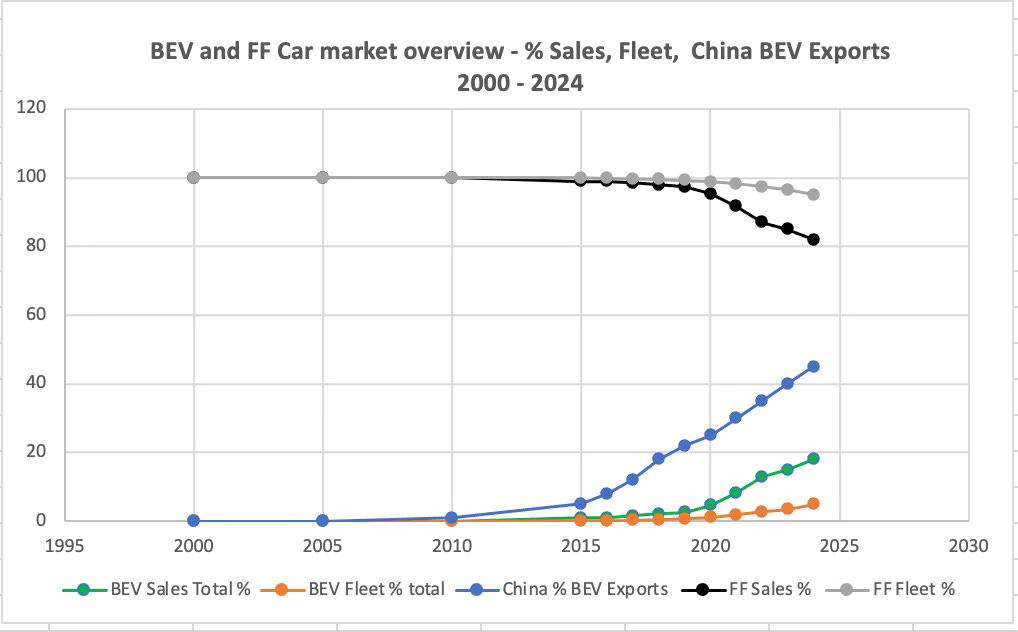
The chart shows the explosion of new sales of BEVs as part of the transport market from practically 0% in 2015 to over 20% this year – with a projection of 40% or more market share by 2030, and over 50% by 2035.
The chart also shows the simultaneous rise in the dominance of the BEV market by China – from 2% of BEV exports in 2015 to over 40% now.
China sells over 60% of the BEVs in the world, and has clear plans to increase BEV sales further – it is clear their sales leadership drives the wider global market growth.
But the chart also highlights the bittersweet story of the on-road car fleet, another massive gradual challenge.
1.5 billion cars
The 1.5 billion fossil fuel cars in the world will take time to electrify, consumer by consumer, unlike power plants where central strategy can be in control.
But gradual will still make the difference.
In 2015 barely 1 in 2000 cars on the road was an EV.
By 2020 this number was 1 in 100 as sales of EVs took off with advent of Tesla mass market cars and Chinese brands.
By the end of this year as sales grow to perhaps 20-25% of the market, the EV fleet will likely reach 1 in 20 of the worlds car fleet – by 2030 this may become 1 in 10, as annual sales reach toward 40% or higher.
If we stretch further forward a little bit to 2035, 1 in 4 cars on the world’s roads may be electric.
Which is why the IEA predicts that oil demand will fall by about 5 million barrels a day by 2030, (if 10% of the fleet is electric, it removes 10% of 40mb/d annual road fuel oil demand) – and if this continues to 2035, 25% of oil road fuel demand disappears, or 10 million b/d - (remember that flatline fossil fuel investment curve we talked about - no wonder.)
Which is why at the top of the chart you can see how the rise of battery technology is mirrored by the decline in sales of internal combustion engine vehicles – sales of fossil fuel cars peaked in 2017 in absolute and percentage terms, and are now 20% down on that summit.
The transport prize is a massive incentive for clean new battery cars.
The 80 million cars sold each year are a $3 trillion annal revenue stream: this is all for fossil fuel to lose, and battery vehicles to gain – they are already claiming a $700bn per year market, growing at 20%, with fossil fuels sales relinquishing the same amount.
Which is why oil demand and ICE car demand, and investments into them, spiral downward together
The fossil fuel system in power and transport is still growing, but now so very slowly, and so close to decline, and so susceptible to high-growth competitors that rapid change is inevitable.
The paradox is the after the largely un-noticed sudden surge in clean energy technology, it is only in this gradual phase of replacement that we will begin to see sudden change.
The transition – gradually now suddenly
With today’s large industrial scale in solar and wind and BEVs we can, to a good approximation, assume that for every unit of clean power coming in, fossil power moves out; for every BEV sold, a fossil car exits.
This still takes time, but the process grinds out the gradual transition from fossil to clean energy technology. Retirements of fossil fuel assets are slow, but retire they will, and at increasing pace.
It has been a long time coming, but this is how fossil fuel demand subsides, and why fossil fuel capex has now hit plateau and is moving into decline.
Forcing the peak in fossil fuel demand has been a grinding, gradual process of technology milestones, policy innovations, and capital influx.
The changes so far this century can mostly be seen as large only in retrospect, taking the wide lens over two and a half decades, and can still feel difficult to observe.
Changing energy from one form to another is well allowed by the First Law, but it never said it would be easy.
But all that prior effort this century will likely pay off in the very near future - the changes in the next half-decade will sharply reflect that gradual ascent of technical, political and financial investments, and force the energy landscape into transformation.
World is suddener than we fancy it, once again.
- - - - - - - - - - - - - - - - - - - - - - - - - - - - - - - - - - - - - - -
FAQ – frequently asked questions, the energy transition
This has been a whistle-stop tour of the energy transition, and it leaves some key questions unexplored in detail.
In this final section let’s tackle a few that often come up generally, or in various forums about the transition.
This will be a - very - brief overview – so feedback is welcome on which issues to cover more in future posts, and our podcast.
Policy - What has been / will be the role of policy in the transition?
The short answer is that policies – supportive (eg strategic vision and economic subsidies) and regressive ( eg reactive tactics and tariffs) – in the energy transition have been and will be central.
But perhaps their greatest job pro-active job has already been done.
Earlier in the century Net Zero framing, the Paris Agreement and emissions analysis from IPCC and others eg Germany’s Engiewende nurtured the development of the key technology standards we have discussed eg wind, solar and battery development and the NEV policy of China has created their leadership in BEVs.
These were far-looking, and resonate hard today.
Recent tariffs from the US and other blocs on raw material and product imports eg solar panels and BEVs may slow the deployment of the new energy system, but not its development.
The policies of the early 21st century have given rise to resilient and robust new clean energy technologies already being installed and bought in the wild.
Giving exponential growth of 15-20% a 25 year head-start is allowing a 50x growth option. You don’t put that back in a bottle.
Resistance to this via tariffs or equivalent isn’t futile, it’s more self-harm.
Absolute growth vs percentage change – percentage changes are fine, but fossil energy is still growing – no?
Yes it is, and this is a good point – and we touched on it several times in the piece.
In absolute terms 2024 fossil fuel growth in primary energy and in power and in road transport still grew at chronically low exponential rates: eg 1-2%.
For example in 2024 fossil fuels grew 1.2% in the power energy sector.
Much is made of the fact that no “peaks in fossil fuel demand” have been reached, whist the trend of rapid clean energy tech growth at 15-20% pa continues.
Simple maths, as discussed, means a percentage peak (in power 20 years ago, in transport, 8 years ago) clearly indicates an absolute one to come - very – soon.
As noted, the new technology has gradually reached such a scale that it is now ready to engulf the existing vast fossil fuel system: first it eats up that low-level annual fossil fuel incremental growth, then it forces the fossil energy system into decline as each new TWh in power displaces fossil TWhs, each new BEV displaces a fossil fuel car.
For sure this takes time - but is the direction going to fundamentally change is some way?
We use percentages as they are more the harbinger of change, while absolutes the passive observance: many corporations and investors may wait until the very last minute to concede change is actually all around them: that is a very risky position.
The financial status of several German carmakers (and Tesla) a clear example of this.
So we focus on the change, the trends underway, and percentages better help describe that.
We’ll cover this issue more in future posts as the predictions and reality meld into action required eg see here – China power emissions have likely peaked. - well within the predictions we have noted here.
Also – it is curious to us how many analysts stop the maths at 2030 – when you run the current clean tech growth rates for just another 5 years, I suspect they are aghast at the implications.
We’ll come back to that soon.
China – does the transition depend too much on China?
Supplementary - as the EU and US appear to reverse clean technology policies and support, does this leave China as the sole standard-bearer of the transition, or a dominant force that Is creating a backlash?
This of course needs a lot longer post.
But let’s say three things:
- China does and will dominate the transition: If the key technologies are wind / solar / batteries and BEVs – transforming about 50% of global energy as we’ve discussed, China dominates every major metric: it deploys more solar energy per year now than for example the US has done in the last 20 years, it has 60% share of world-wide BEV battery capacity, and all the raw materials and processing plant required, and it dominates global BEV car sales and exports – and is growing at 15-20% pa in all these categories
- Likely this creates a counter-reaction – and that may mean anti-China sentiment means anti-transition sentiment by default – but again that is more a slow-down, not an existential change
- Is China dominance a problem? - China is 20% of the global population, and has the majority of the world capacity to manufacture the energy system of the future – as lap-tops arrive at our door at low-cost and high quality, so will EVs and low-cost electric power
The energy world has moved from extraction to manufacturing – so yes, we now depend heavily on China
Just as in 1950 when we moved from coal to oil and gas we may have asked - do we depend too heavily on Saudi Arabia?
8 billion folks depending on energy have to depend on someone, as we are not all blessed with giant oil-fields, or manufacturing scale and technical know-how.
Other technologies - why not “all of the above” – there is little mention of nuclear, hydropower, hydrogen, fusion, carbon capture and others – why ?
There’s no doubt that nuclear and hydropower have provided a baseload of about 30% in the power sector, or about 10% total primary energy. However, their contribution has barely changed this century (or indeed in the past 50 years), due to high costs and high risks of deployment.
As for some of the more speculative technologies their only contribution in the past 20 years has been to act as a distraction siphoning capital off into magical engineering such as green hydrogen, and direct air capture.
These ideas have not appeared at any decent scale: the transition is about making choices, so we have focussed on those technologies that have emerged at major size.
What about the other 50% - industry, heating, aviation, chemicals etc? - they seem harder to replace
Yes they are: but they are also only 50% of the total, and as soon as electricity becomes very cheap, electrical solutions to some of these areas such as industrial heat and processing eg for steelmaking will likely develop.
The transition strategy is best to focus on what we can achieve quickly - power and transport - rather than quibble over perfect solutions to more complex problems that will likely yield to improved technology and techniques, aided by developing the energy tech we can deploy today.
In cliche terms, solve the low-hanging fruit, and the ideas for the high-fruit will emerge - but also see below.
Energy efficiency – isn’t that a major part of the transition?
Yes, it is. But be aware of giving primacy or equality to high-cost, slow-to-implement incremental solutions, versus technology leap-frogs.
Time and money have to be targeted effectively.
Efficiency can mean a new abrupt technology shift such as lithium-ion batteries at industrial levels as much as meaning better lagging of pipes – both are valuable, but the former works at a far different scale.
A fragile transition - So does it all boil down to wind, solar, batteries, BEVs and China: is that robust ?
The fact we have the technologies at scale at all is a massive shift from the start of the century.
Sole reliance on fossil fuels for the energy century ahead would be far far more brittle, and precarious.
These new technologies now give us an alternative energy option – and with all their issues and problems that we will debate, best we have an alternative than not have one at all.
US – China energy divergence – is China going to lead 21st century energy, and the US fade from it because of its choices and policies?
Looks like it, yes.
The manufactured nature of the new energy technologies mean a decade-long lead can last a century - compound growth quickly gains market share in solar, battery and BEV products.
Think google’s reach more than nurturing large but declining domestic oil-fields – will shale have as much a century-long global energy impact as cheap electricity and cheap electric cars?
The US drift in the past ten years to fossil fuels via shale oil, tariffs to protect (limited) development in solar rather than a focus on deployment, and reliance on a single unpredictable EV brand, rather than a national EV policy, leaves it well behind in new energy technology – likely for the rest of this century.
We can debate, but you did ask.
The long view – what does energy look like in 2050 or 2100?
For 2050 - a simple option is to extrapolate the charts in this piece at say 10% pa for the next 20 years, and assume China stays disciplined.
That would mean wind and solar would be 80% global power supply, and BEVs 90% of car sales and 50% of the cars on the road.
Solutions for the “hard-to-abate” sectors eg industry occur as they are incentivised by tech breakthroughs.
2050 and beyond ? A few suggestions.
Oil and gas companies outside OPEC may not exist, only 4-5 car companies might dominate global car sales – much like Apple and Samsung now dominate phones and lap-tops.
Carnage at the corporate level, disruption at the geo-political stage, more benevolent energy for the consumer, the beginning of the repair of the environment.
Emissions – you haven’t mentioned those?
See Laplace – we no longer have any need of that hypothesis – this transition is the solution itself

Insightful. Thanks!
Sorry to be boring and tenacious. My point is that $500 billion for just 3 recent climate events in the US, or, as is happening where I live (NSW Australia) at this moment, we are coming out of a 1 in 500 year flood event with massive damage to property and livelihoods ...... and funny this, but this 1 in 500 year event is not a lot different to the flooding event in 2022 ... maybe that was just a 1 in 100 year event???
My point is that there is a lot of climate damage built in and we seem quite passive about making it worse. I agree with you that China and India, Asia, Africa understand what is going on and I fully expect that soon China and India at least will actively pull ICE vehicles out and replace them with BEVs.
Perhaps the US will try to ignore this, but the rest of the world isn't going to let it when (soon) all coral reefs are gone etc etc etc. Somehow we need to convince markets, investors etc that essentially all burning of fossil fuels must stop long before the use-by date of the existing technologies.